Guide: How to Choose Data Management and Analysis Software
This guide focuses on six of the most widely used tools in the entrepreneurial and startup ecosystem: Airtable, Supabase, Mixpanel, PostHog, Hotjar, and Segment. For each one, you’ll find a detailed overview, the user profiles they’re best suited for, and an honest analysis of their strengths and limitations. All of them offer discount through Freelance Stack, in the Analytics and Data Management category.
When choosing data software, the first step is to understand exactly what you want to know.
Data has become the fuel for all digital activity, whether it’s a freelancer tracking client performance, a SaaS company trying to understand why users drop off at step 3 of the onboarding process, or a startup looking to organize its information before everything gets out of hand. And yet, faced with the abundance of available tools, manyentrepreneurs stillentrepreneurs their way in the dark, piling on solutions without really knowing why.
The problem is rarely a lack of tools. It’s often the opposite: too many options, Categories , and a tendency to confuse tools that serve different purposes. A database, a product analytics tool, a user behavior platform, a CDP… each addresses a specific need, and choosing the wrong one at the wrong time can be costly-in both time and money.
This guide focuses on six of the most widely used tools in the entrepreneurial and startup ecosystem: Airtable, Supabase, Mixpanel, PostHog, Hotjar, and Segment. For each one, you’ll find a detailed overview, the user profiles they’re best suited for, and an honest analysis of their strengths and limitations. All of them offer on Freelance Stack, in the Analytics and Data Management category.
Before going into detail about the tools, it is helpful to clarify the main categories that make up this ecosystem.
Databases:
(Supabase, MongoDB, Neon...) store and organize data. They form the foundation which everything else is built.
Product analytics tools:
(Mixpanel, Amplitude, PostHog...) track your users' behavior within your product, event by event.
Behavioral analytics tools:
Hotjar tracks what your visitors do on your web pages: where they click, how far they scroll, and what causes them to leave.
Customer Data Platforms:
Segment centralizes data collection from all your sources and distributes it to your other tools.
Understanding these distinctions is half the battle.
#1 - Airtable: The collaborative database for everyone.
Airtable occupies a unique position within this ecosystem. Depending on how it’s used, it can serve as a database, a project management tool, or a no-code platform. Its positioning has remained unchanged since its launch in 2012: to offer the power of a relational database with the accessibility of a spreadsheet, without a single line of code.
Concept and features:
The core concept is that of "databases": workspaces where you organize your data into interconnected tables. Each table can contain fields of various types: text, number, date, drop-down list, attachment, formula, link to another record... This last type is particularly powerful: it allows you to create relationships between tables, just like in a true relational database, without using SQL.
Another key feature is the ability to view the same data in multiple ways: you can display the same set of information as a grid, a Kanban board, a calendar, a gallery, or a Gantt chart, depending on the context. A sales team will view its leads on a Kanban board, while the planning team will view the same data on a calendar.
Native automations let you trigger automatic actions-such as sending an email, creating a record, or sending a notification via Slack-based on defined conditions. And recently, Airtable AI has made it possible to enrich or summarize fields directly from the interface, without needing a third-party tool.
Integrations with tools like Notion, Make, Zapier, and Retool make it a flexible data hub that’s easy to connect to your tech stack.
Pricing:
The free plan covers up to 1,000 records per database and 5 editors, which is enough to get started. The Team plan ($20/user/month) unlocks unlimited records and advanced automations. The Business plan ($45/user/month) is designed for teams that need granular permissions and greater access control.
Who is Airtable for?
For creatives and project managers:
Whether you want to manage a content pipeline, track client briefs, or coordinate an editorial team, Airtable is likely the best tool on the market in this category. Its visual interface makes it easy to understand right away, even for users with limited technical expertise.
For freelancers and consultants:
For those who want to centralize their customer management, set up a lightweight mini-CRM, or track multiple projects without a large software budget: the Free and Team plans are sufficient in the vast majority of cases.
For early-stage startups:
For those who need to quickly organize their processes (product backlog, applicant management, partnership tracking) before investing in more specialized tools: Airtable is an excellent starting point.
The benefits:
✅ Easy to use right away-no training required.
✅ Multiple views of the same data-very useful for cross-functional teams.
✅ Powerful native automations, accessible without coding.
✅ A wide range of integrations.
The drawbacks:
❌ The limits of the free plan (1,000 records) are quickly reached.
❌ Large databases (100,000+ records) may experience slow performance.
❌ Not designed for complex queries or advanced developer use.
Benefit from a on Airtable .
$1,000 in credits
Find our best discount right now with Airtable and save on your software subscriptions. We offer over 850 promo codes and discounts on the best software and SaaS on the market.
#2 - Supabase: the open-source backend for developers who want to get things done quickly.
Supabase is often described as "the open-source alternative to Firebase." This description sums up its offering well: a comprehensive, managed backend platform built around PostgreSQL, which combines a relational database, automatically generated REST and GraphQL APIs, an authentication system, file storage, and serverless functions into a single service.
Launched in 2020 and backed by a highly active developer community, Supabase has established itself as the go-to choice within the Next.js ecosystem for entrepreneurs early-stage startups looking for a solid foundation without the complexity of manually managing infrastructure.
Concept and features:
Supabase is built on PostgreSQL: one of the most robust and mature relational database management systems on the market. You get the full power of SQL, relationships, indexes, and extensions (such as PostGIS for geospatial data and pg_vector for AI), all accessible through a user-friendly administration interface (called "Studio") directly from your browser.
Row-Level Security (RLS) allows you to define data access rules at the row level, without going through an application layer. It is a powerful mechanism for multi-user applications where each user should only see their own data.
Edge Functions allow you to run server-side TypeScript code at the edge, which is useful for webhooks, data transformations, or integrations with third-party APIs. Supabase Realtime lets you monitor changes in your database in real time, which is useful for collaborative applications or live dashboards.
For projects that require visibility into the infrastructure, Datadog integrates seamlessly as a monitoring solution.
Pricing:
The free plan is generous: 500 MB of base storage, 5 GB of total storage, and 50,000 monthly active users. The Pro plan ($25/month) offers much higher limits and dedicated support. Self-hosting is completely free and open-source for projects that choose it.
Who is Supabase for?
For solo developers and makers:
For those building a web or mobile app who want to focus on the product rather than the infrastructure: Supabase saves weeks of setup time.
For early-stage tech teams:
For those who need to quickly launch an MVP with a sound architecture without accumulating technical debt: PostgreSQL is a sustainable choice that will scale with their growth.
For data engineers in a lightweight environment:
Who want to use PostgreSQL as a central data source, connected to analytics tools via Fivetran or custom pipelines.
The benefits:
✅ Powered by PostgreSQL: no compromises on power and flexibility.
✅ Open-source and self-hosted, giving you complete control.
✅ Authentication, storage, APIs, and a database-all in a single subscription.
✅ One of the most generous free plans on the market.
The drawbacks:
❌ Requires coding skills; at a minimum, proficiency in SQL.
❌ Costs may increase depending on network transfer volumes.
❌ Not suitable for non-technical users or purely no-code projects.
Benefit from a on Supabase .
$50 in free credits
Find our best discount right now with Supabase and save on your software subscriptions. We offer over 850 promo codes and discounts on the best software and SaaS on the market.
#3 - Mixpanel: Product analytics to help you make decisions based on the right metrics.
Mixpanel is an event-based analytics platform. Unlike Google Analytics, which primarily measures sessions and page views, Mixpanel tracks every individual action taken by each user: a click, the completion of an onboarding step, an upgrade, or a cancellation. This level of detail is what sets it apart, and it’s exactly what product teams need to understand why users do what they do.
Founded in 2009 in San Francisco, Mixpanel is now used by thousands of SaaS startups, mobile apps, and growth teams around the world.
Concept and features:
Funnel reports are at the heart of the tool: they show, step by step, at which point users drop off a flow (sign-up, onboarding, checkout). Retention measures how many users return to your product after their first interaction. Flows visualize the paths taken between two points in your app. These three metrics form the foundation of any serious product improvement effort.
Mixpanel also allows you to create user cohorts based on behavior (all users who performed action X but not Y within the first 7 days), conduct basic A/B testing, and finely segment all analytics by user or event attributes.
The tool natively connects to CDPs like Segment to centralize event tracking from all your sources.
Pricing:
The free plan covers up to 20 million events per month, which is very generous for a startup project. The paid plans (Growth, Enterprise) unlock data governance, CSV/JSON exports, shared reports, and priority support. Pricing is based on event volume.
Who is Mixpanel for?
For SaaS and mobile app developers:
Who want to understand how their users progress through the onboarding process, identify stages with high drop-off rates, and measure the impact of each release on user behavior.
For Product Managers and growth teams:
Who need reliable behavioral data to make decisions, not to confirm their intuitions. Mixpanel enforces a rigorous approach to defining metrics, which is, in itself, a good practice.
For startups in the growth phase:
Who want to track their retention rates at 7, 30, and 90 days, identify the most active cohorts, and anticipate churn before it becomes a problem.
The benefits:
✅ Some of the most powerful and mature event analytics on the market.
✅ A very generous free plan to get started hassle-free.
✅ An analytics interface accessible to non-data professionals.
✅ Seamless integration with most tech stacks (via native SDKs or through a CDP).
The drawbacks:
❌ Implementing events requires the assistance of a developer.
❌ Can become expensive at very large scales, depending on the volume.
❌ Less suitable for pure marketing analytics (acquisition, SEO, campaigns).
Benefit from a on Mixpanel .
1 year free
Find our best discount right now with Mixpanel and save on your software subscriptions. We offer over 850 promo codes and discounts on the best software and SaaS on the market.
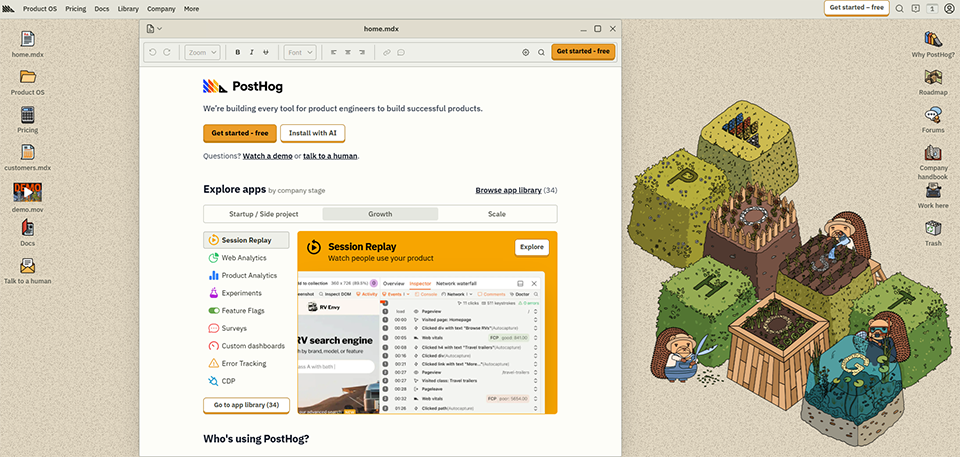
#4 - PostHog: the all-in-one platform for understanding your users without having to use multiple tools.
PostHog is based on a simple observation: most product teams end up using four or five separate tools to meet their analytics needs. One for funnels, another for session recordings, a third for feature flags, a fourth for A/B testing... PostHog offers to consolidate all of this into a single platform-open-source and self-hosted if needed.
Launched in 2020 by a team that had gone through Y Combinator, PostHog quickly built a very active community, particularly among developers and founders who are wary of overly closed-off tools or data privacy concerns.
Concept and features:
PostHog natively supports:event analytics (funnels, retention, cohorts, dashboards), session recordings (user session recordings), feature flags (gradual feature rollout), A/B testing, and in-app surveys. This level of functional depth is hard to find elsewhere in a single tool.
The self-hosting aspect deserves special attention: PostHog can be deployed on your own infrastructure, which means your data never leaves your environment. For projects handling sensitive data or subject to strict GDPR requirements, this is a major selling point.
The tool has also included a native data warehouse in recent versions, allowing you to query your analytics data directly via SQL without exporting it to a third-party tool.
Pricing:
The free plan covers 1 million events per month, 5,000 session recordings, and access to all core features. Beyond that, billing is pay-as-you-go, with no mandatory subscription fee. For self-hosting, PostHog is completely free and open-source.
Who is PostHog for?
For developers and indie hackers:
Who appreciate open-source tools, want to retain control over their data, and don’t want to manage multiple subscriptions for overlapping needs.
For startups with strict data privacy requirements:
Self-hosting simplifies GDPR compliance by eliminating the transfer of data to third parties.
For product teams looking to consolidate their tech stack:
Replacing Hotjar, Mixpanel, and LaunchDarkly with a single tool offers real benefits in terms of management and cost, especially for a small team.
The benefits:
✅ Very broad functional coverage for a single tool.
✅ Open-source, self-hosted, full control over your data.
✅ Pay-as-you-go pricing, with no minimum subscription required.
✅ Active community and high-quality documentation.
The drawbacks:
❌ Self-hosting requires technical expertise and regular maintenance.
❌ Some advanced features are still less mature than those found in specialized tools.
❌ The interface may seem less streamlined than that of more specialized competitors.
Benefit from a on PostHog .
$50,000 in credits
Find our best discount right now with PostHog and save on your software subscriptions. We offer over 850 promo codes and discounts on the best software and SaaS on the market.
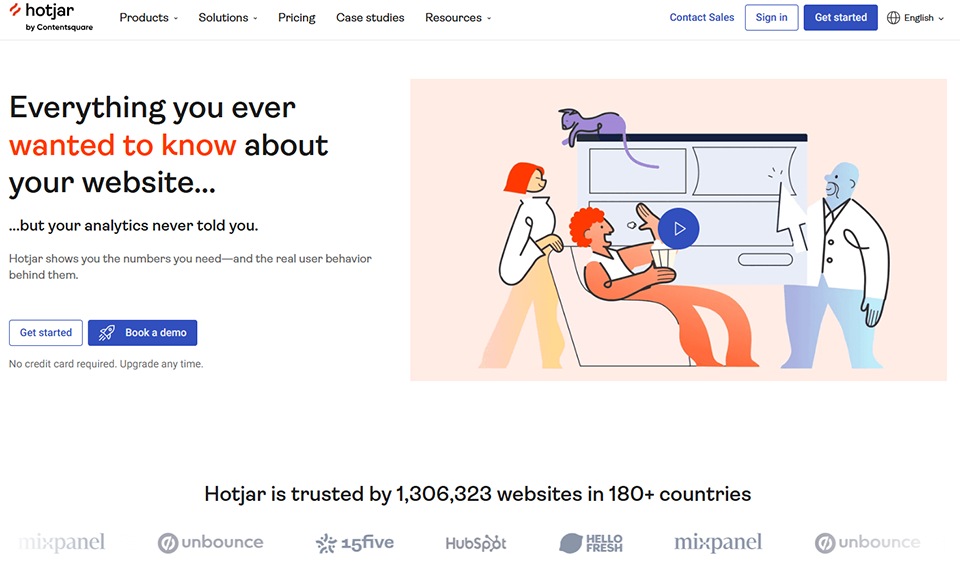
#5 - Hotjar: Understand your visitors' behavior without needing to be a data analyst.
Hotjar doesn't track events or databases. Instead, it focuses on something else: how your visitors interact visually with your pages-where they click, how far they scroll, and when they leave. It's a complementary approach to traditional analytics tools and often more intuitive for non-technical users.
Founded in Malta in 2014 and acquired by Contentsquare in 2021, Hotjar has established itself as an must-have tool must-have UX teams, growth marketers, and conversion consultants looking to improve the user experience based on concrete evidence.
Concept and features:
Heatmaps are the standout feature: they aggregate the behavior of all your visitors on a page and show where they click, how their mouse moves, and how far down they scroll. The result: at a glance, you can see which areas capture attention and which ones are ignored.
Session recordings let you replay a user’s exact journey, as if you were looking over their shoulder. That’s often where the real insights emerge: confusion a form, a button that looks like text, or a step in the funnel that wasn’t understood.
In-page surveys and feedback widgets allow you to collect qualitative feedback directly on your website, without sending an email or scheduling an interview. Combine a session recording with survey responses, and you’ll gain both a quantitative and qualitative understanding of the issue.
Hotjar integrates easily with tools like Segment, Google Analytics, and CRMs such as HubSpot.
Pricing:
The free plan includes 35 recorded sessions per day, heatmaps for an unlimited number of pages, and one active survey. The paid plans (Plus at €32/month, Business at €80/month) unlock higher session limits, advanced filters, and additional integrations.
Who is Hotjar for?
For website developers and e-commerce businesses:
Who want to understand why visitors abandon their shopping carts, where on the product page they lose interest, or what’s holding back conversions on a sign-up form.
For growth marketers and UX designers:
Who need concrete visual data to support and guide their redesign decisions, rather than relying on assumptions.
For conversion optimization consultants:
For customer support: Heatmap captures and session recordings provide visual evidence that is far more compelling than a simple report with numbers.
The benefits:
✅ No technical skills are required to get started.
✅ Intuitive and immediately actionable visualization.
✅ A rare combination of quantitative data (heat maps) and qualitative data (surveys).
✅ The free plan is enough to get started and draw some initial conclusions.
The drawbacks:
❌ Does not track complex events, retention, or user cohorts.
❌ The storage capacity of affordable plans may be insufficient for high-traffic websites.
❌ Less suitable for native mobile apps or complex SaaS products.
Benefit from a on Hotjar .
Additional 40% off on annual plan
Find our best discount with Hotjar and save on your software subscriptions. We offer over 850 promo codes and discounts on the best software and SaaS on the market.
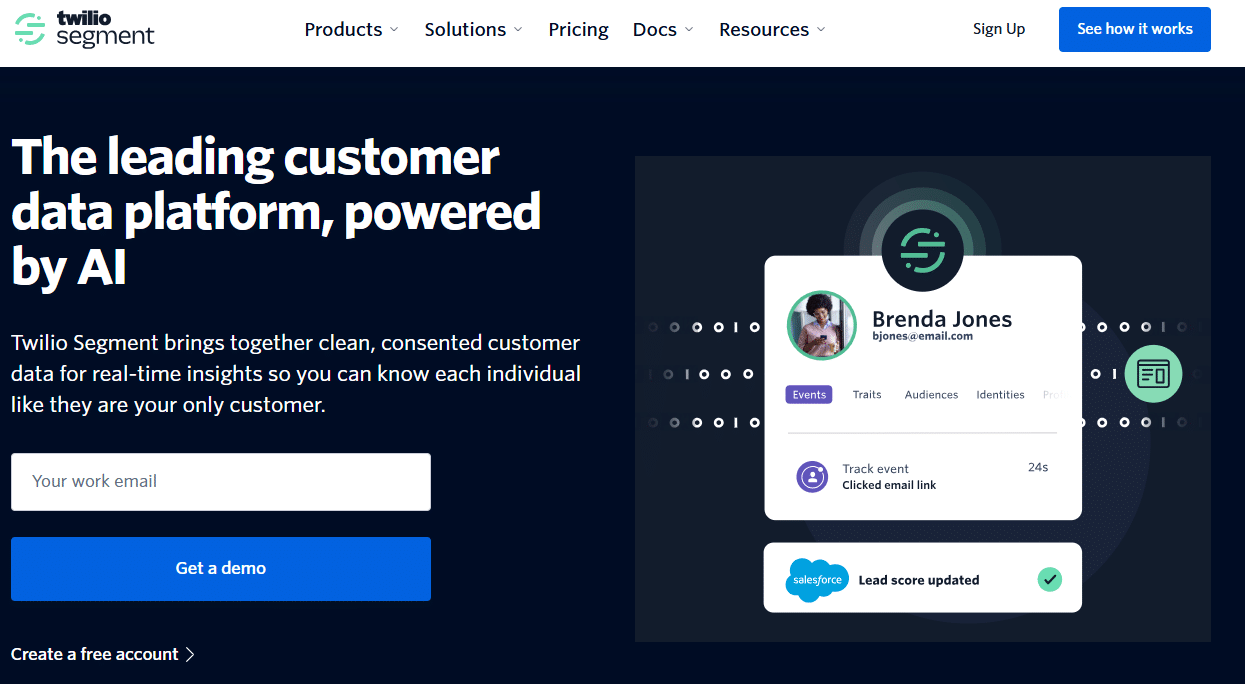
#6 - Segment: the data collection layer to unify your tech stack.
Segment isn't strictly speaking an analytics tool. It's a Customer Data Platform (CDP) designed to centralize the collection of all your user data from across all your sources (website, mobile app, server, CRM, etc.) and distribute it to every tool in your stack that needs it.
Without Segment, the situation is often the same: you end up implementing the same events three times across three different systems, definitions vary from team to team, and every time you switch tools, you have to start from scratch. With Segment, you implement the events once and configure the destinations directly from the interface, without touching the code.
Acquired by Twilio in 2020 for $3.2 billion, Segment is now the leading customer data platform (CDP) for startups and growing companies.
Concept and features:
At the heart of Segment is its connection library: over 400 pre-integrated sources and destinations, with SDKs available for JavaScript, iOS, Android, Python, Ruby, Go, and more. You collect your data once, then activate the destinations of your choice from the interface: Mixpanel, Hotjar, HubSpot, Salesforce, your data warehouse, and more.
Protocols allow you to define and validate a precise tracking plan: which events exist, what mandatory properties they have, and in what format. It is a data governance mechanism that prevents individual developers from creating their own event conventions.
Journeys (an advanced feature) allow you to create automated, multi-channel customer journeys based on actual behavior: trigger a reactivation email, update a CRM field, or send a push notification depending on what the user has or hasn’t done within your product.
Pricing:
The free plan is limited to 1,000 unique visitors per month and two connected sources, which is sufficient for testing and validating the setup. The Team plan starts at $120/month for 10,000 monthly visitors. Beyond that, pricing is customized based on volume.
Who is Segment for?
For startups that use multiple analytics and marketing tools:
Avoid duplicate tracking, gain the flexibility to switch tools without having to reimplement everything, and maintain a single source of truth for user behavior.
For growing data-driven teams:
Who want to lay a solid foundation for data collection from the very beginning-one that can scale without requiring a major overhaul.
For small and medium-sized businesses looking to centralize their customer data:
Consolidate data from the website, customer support, CRM, and emails into a single location that all teams can use.
The benefits:
✅ A centralized repository for all user data.
✅ Over 400 integrations available.
✅ Saves a significant amount of time on implementation and migrations.
✅ Sustainably improves data quality and consistency.
The drawbacks:
❌ Free plan with very limited traffic (1,000 visitors per month).
❌ Requires time to set up a solid tracking plan from the start.
❌ Can become expensive depending on the volume and the number of destinations activated.
Benefit from a on Segment .
No deals currently available
Find our best discount right now with Segment and save on your software subscriptions. We offer over 850 promo codes and discounts on the best software and SaaS on the market.
A comparison chart is often more helpful than a long paragraph when you need to step back and take a broader view. Here is one, highlighting the key factors to consider before making your choice. Note that these tools aren’t necessarily in direct competition with one another: some are complementary, and the best data stack for a startup often combines two or three of them.
How can you build a data stack that’s right for your stage of development?
Choosing a data tool isn't something you do in a vacuum. The real question isn't "What's the best software?" but "What's the right tool for where I am right now, given the resources I have?"
Here are three common configurations, taken from real-world profiles.
You're starting out on your own or with a small team, without a dedicated technical role :
The priority is quick setup and versatility. Airtable for organizing your data (customers, projects, content) and Hotjar for understanding how your visitors interact with your site provide a very solid starting point-without a single line of code. Both tools are up and running in just a few hours, their free plans are sufficient for testing an approach, and they address very different needs without competing with each other.
Are you developing a SaaS product or an app :
Here, the stack is often organized into three layers. First, the database: Supabase is an excellent choice for teams that have a developer or know how to code. Next, the analytics tool: Mixpanel or PostHog, depending on whether you prefer specialization (Mixpanel) or centralization (PostHog). Finally, if you use multiple marketing and analytics tools in parallel, Segment as a data collection layer ensures you never have to reimplement the same events twice.
Your business is growing, and you're looking to streamline your operations :
This is often when the first friction arises: data scattered across ten different locations, reports that don’t match up, and teams that don’t share the same definition of an “active user.” This is where Segment truly comes into its own as the foundation for data governance. Fivetran can be used as a complement to feed a data warehouse. And tools like Snowflake or Databricks come into play for teams that need to analyze large volumes of structured data.
One last practical tip: start small! The biggest risk isn’t choosing an imperfect tool-it’s spending three months evaluating solutions without ever implementing anything. An average tool, used regularly and properly configured, delivers more value than a perfect tool that sits unused.
See all the software of this category: Analytics et Management des Données
Check out all the other software and discount we offer in this category. Explore other tools and choose the perfect solution to grow your business.
FAQ: What questions do you have about data software? ❓
The most common questions deserve straightforward answers. Here are six of them, drawn from the most frequently asked questions by entrepreneurs and freelancers who are just starting out or refining their data strategy.
1️⃣ What is the difference between a database and an analytics tool?
Both deal with data, but at different stages of its lifecycle. A database stores information in a structured way and allows you to query it. An analytics tool transforms this raw data into metrics, visualizations, and actionable insights. In practice, your stack will often include both: a database (Supabase, MongoDB...) and an analytics tool connected to that database. Confusing the two is often the source of a poor purchasing decision.
2️⃣ Do I need Segment if I already use Mixpanel?
Not necessarily at first. If you only have one analytics tool, Segment adds a layer of complexity that isn’t always justified. However, as soon as you start using multiple tools in parallel (Mixpanel, a CRM, an email marketing platform, a support tool, etc.), Segment becomes a real time-saver by centralizing data collection and eliminating redundant implementations. The investment pays off as your tech stack becomes more complex.
3️⃣ Can Airtable replace a real database?
For simple to intermediate needs, yes. Airtable is perfectly suited for managing an internal CRM, a product backlog, a content catalog, or customer tracking. If your project involves large volumes (tens of thousands of records), complex SQL queries, or advanced application logic, you’ll need to switch to a dedicated relational database like Supabase or MongoDB.
4️⃣ PostHog or Mixpanel: How to Choose?
Both tools are robust when it comes to product analytics, but their approaches differ. Mixpanel is more mature, more streamlined, and better suited for teams that want to focus on high-quality event-based analytics. PostHog is more comprehensive: it covers a wider range of use cases (recordings, feature flags, A/B tests) and is suitable for teams that want to consolidate their stack into a single tool, with the option to self-host. If data privacy is a priority, PostHog often stands out as the best choice.
5️⃣ Do you have to be a developer to use these tools?
It really depends on the tool. Airtable and Hotjar require no technical expertise: they have a graphical interface and are easy to get started with. Supabase, PostHog, and Segment, on the other hand, require familiarity with code and APIs. Mixpanel falls somewhere in between: the reporting interface is accessible to everyone, but the initial implementation of events requires a developer.
6️⃣ How do you choose between Hotjar and PostHog for user behavior analysis?
Hotjar is more accessible and focused on web navigation: heatmaps, session recordings, and surveys. PostHog is better suited for SaaS products or complex applications where you need to go beyond simple observation. If you manage a showcase site or an e-commerce site, Hotjar will likely meet most of your needs. If you’re developing a SaaS product and want a comprehensive view of user behavior combined with feature flags and A/B testing, PostHog will be more relevant in the long run.
This guide brings together the 12 must-have e-commerce tools must-have 2026, selected for how well they complement each other: platforms to create your…